Serie A in numbers so far
The first international break provides the first chance to look beyond the table. The 2026/27 Serie A season has already begun to reveal different styles and identities that the standings alone only tell part of the story. Shots, Expected Goals, possession, pressing and recoveries offer a closer look at how teams are attacking, building play and defending, highlighting trends that are already taking shape after five rounds.
The sample size is still small and inevitably influenced by the schedule, but the numbers provide an interesting first snapshot. They show not only which teams are producing the most, but also, more importantly, how each team is going about it.
Attacking output: Inter, Roma and Como lead the way
Inter, Como and Roma are the three leading teams when it comes to attacking output, ranking near the top for total shots, shots on target and Expected Goals. Their attacking threat is also reflected in how often they get the ball into the most dangerous area of the pitch. Roma leads Serie A for touches in the opposition box (219), just ahead of Inter (215) and Como (209).
The picture changes when we look at big chances. Inter (28) and Roma (24) remain out in front, but Monza jumps into third with 20 big chances, 16 of which have gone unconverted. Only Inter has missed more, with 20.
Among the teams producing less, AC Milan’s numbers are perhaps the biggest surprise, ranking just 14th for shots with 12.8 per game. Parma, meanwhile, ranks last for both total shots and shots on target, as well as for xG (3.1), with Atalanta next on 4.1 xG. Atalanta also ranks last for big chances created, with just three.
Producing chances, however, is only half the job. The next step is turning those opportunities into goals. Venezia (-5.2), Bologna and Monza have the largest negative differences between goals scored and xG, meaning they are the teams that have left the most goals on the table relative to the quality of the chances they have created.
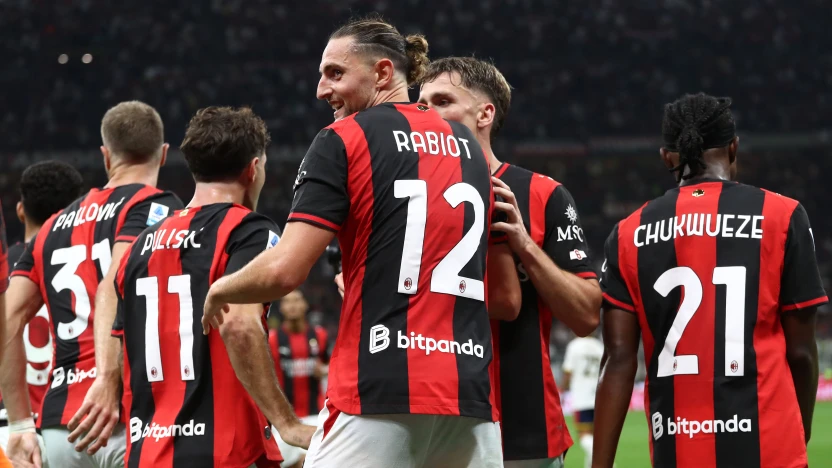
At the other end of the scale is AC Milan, which, despite taking relatively few shots, has the highest conversion rate in the league at 15.6%, ahead of Roma, Inter and Lazio. At the bottom are Bologna (4.48%), Genoa and Venezia. AC Milan (+2.1) also has the league’s highest finishing overperformance, followed by Frosinone (+1.5) and Roma (+1.2).
It’s not just about how often you shoot
Where chances come from also gives us a better picture of attacking output. Lecce have scored four of their five goals from set pieces, while AC Milan, Fiorentina, Venezia and Parma are still waiting for their first set-piece goal.
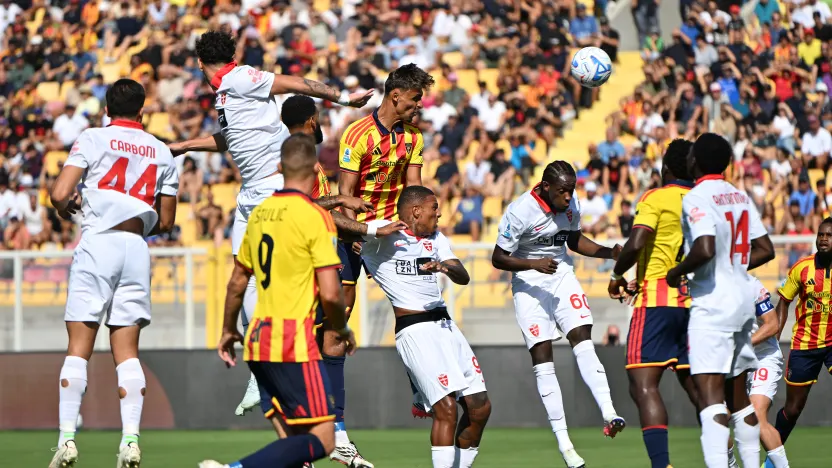
Lecce also leads Serie A for xG per shot (0.13), level with Inter and Roma. The stat measures the average quality of a team’s shots and, in Lecce’s case, is also influenced by the number of goals they have scored from set-piece situations. At the other end of the table are Atalanta (0.07), followed by Genoa, Como and Parma (0.08).
Como’s numbers are particularly interesting. They rank among the league leaders for attacking volume, touches in the box and overall attacking output, but the average quality of their individual shots remains among the lowest in the league. Getting into dangerous areas regularly, then, does not necessarily mean creating the best possible shooting opportunities.
Build-up: more than one way to control the ball
If attacking stats tell us where an attack ends, possession data gives us a better idea of how teams get there.
Inter leads Serie A for average possession (63%), ahead of Como, AC Milan and Roma. At the other end are Lecce (38.6%), Cagliari and Frosinone. The completed passes rankings look very similar, with Inter again on top at 547.6 per game, followed by Como, AC Milan and Roma, while Frosinone, Lecce and Fiorentina bring up the rear. Inter also leads for passing accuracy, at 89.9%, ahead of Como and AC Milan, while Frosinone, Lecce and Parma rank at the bottom.
But pass volume and accuracy only tell part of the story when it comes to build-up play. Venezia, for example, ranks fifth for average possession (57.1%), but also leads the league for misplaced short passes per game (53) and ranks second for errors leading to an opposition shot (7), behind only Lecce (8). Their sequences highlight the difficulty Venezia has had turning possession into forward progress: 60 possessions of at least 10 passes have produced just seven “built attacks.” Plenty of possession, then, but still not enough consistency in turning it into effective attacking moves.
At the other end of the scale, Roma is the only team yet to concede a shot following one of its own build-up errors.
Possession play to direct attacks
Possession sequences are where we see most clearly just how different teams’ approaches can be when it comes to moving the ball forward.
The clearest example is Frosinone. A league-high 47.8% of their passes go forward, but the other metrics reveal an even clearer picture of their style. They rank first for Direct Speed (2.44) and Direct Attacks (16), while ranking last for sequences of at least 10 passes (11), passes per sequence (2.22) and average possession duration (5.98 seconds). The idea is clear: keep the ball for as little time as possible and move up the pitch as quickly as possible. No other team has such a distinctly vertical profile.
At the other end of the spectrum is AC Milan. The Rossoneri rank last for Direct Speed (1.29), but second for sequences of at least 10 passes (92), third for average passes per sequence (4.66) and second for average possession duration (12.98 seconds). The result is a patient build-up, with the team tending to keep possession for longer before moving forward.
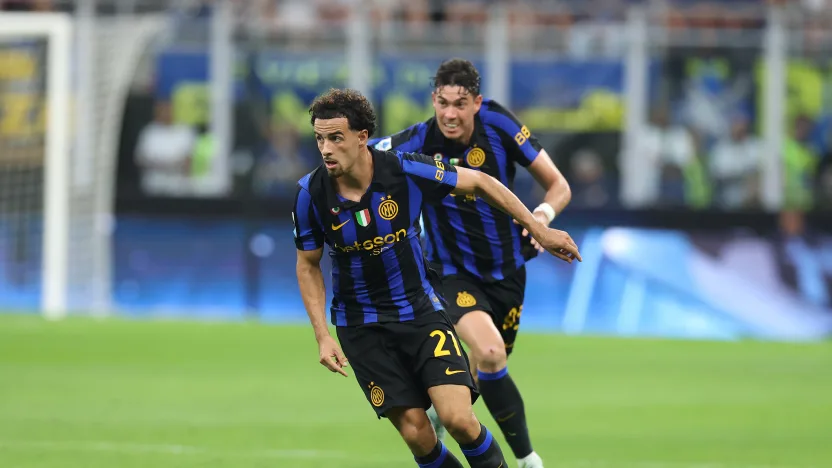
Inter takes this approach even further. The Nerazzurri lead both for passes per sequence (4.91) and average possession duration (13.92 seconds), while also ranking third for Build Up Attacks (24). Their six Direct Attacks complete the picture of a team that prefers to establish possession and build through the longest and most elaborate sequences in the league.
Como, meanwhile, has shown an ability to change approach depending on the situation. They lead both for sequences of at least 10 passes (100) and Build Up Attacks (30), while also ranking second for Direct Attacks (15). Possession and verticality are not mutually exclusive. Fabregas’ side can patiently build through long sequences but can also accelerate immediately when space opens up.
A similar versatility, with a greater emphasis on progressing vertically, can be seen in Roma. They rank third for sequences of at least 10 passes (87), joint third with Inter for Build Up Attacks (24) and second alongside Como for Direct Attacks (15). Their Direct Speed of 1.91, higher than Como (1.72), Inter (1.52) and AC Milan (1.29), further highlights a team capable of switching between possession play and acceleration.
The teams that see the most of the ball, then, do not all use it in the same way. Inter builds through long, intricate sequences; AC Milan tends to keep possession for longer before moving forward; Como and Roma combine structured possession with direct attacks. Frosinone sits at the other end of the spectrum, with fewer passes and an immediate search for space in behind.
Crosses, long-balls and one-on-ones: other ways to move forward
Structured possession is naturally not the only way to gain ground. Inter completes 8.2 crosses per game, the most in the league ahead of Roma and Como, while AC Milan ranks 10th. Lazio, Atalanta and Lecce bring up the rear with 2.2. The Nerazzurri are also the most accurate, with a 37.3% completion rate, ahead of Frosinone and Roma. Frosinone’s numbers fit their overall style: despite ranking last for possession play, they have the fifth-highest total for completed crosses, adding another way to move the ball forward quickly.
Long balls tell a different story, with Udinese leading the way with 28 accurate long balls per game, just ahead of Inter (27.4) and Roma. Once again, Inter stands out for accuracy, leading the league by a clear margin at 64.6%.
Then there is the individual approach. Como (10.4), Roma and Fiorentina complete the most dribbles per game, while Monza (4.4), Napoli and Parma rely least on one-on-one situations. Interestingly, Monza also allows the fewest dribbles by opponents (4.4), level with Inter and just ahead of Juventus (4.6).
Defence and pressing: being aggressive does not necessarily mean defending better
Defensive numbers can also tell very different stories beneath the surface. Juventus has the lowest xG conceded in Serie A (2.4), ahead of Bologna (4.7) and Monza (5.3), followed by Roma and AC Milan.
Monza provides one of the clearest examples of how the numbers can differ. Despite having the league’s third-lowest xG conceded, they have already allowed 12 goals. Their +6.7 differential is the worst in Serie A.
At the other end of the spectrum are Cagliari and Frosinone. Frosinone has conceded 10.5 xGA but allowed just four goals, for a -6.5 differential, while Cagliari’s is even lower at -6.8. The two teams are comfortably ahead of the rest when it comes to the gap between the quality of chances they have allowed and the number of goals they have actually conceded.
It is no surprise, then, to see them among the leaders for clearances, alongside Lecce. The Salentini lead the way for tackles, averaging 23.6 per game, ahead of Roma and Frosinone, while Parma, Atalanta and Juventus rank at the bottom. Frosinone also ranks third for interceptions, behind Roma, who lead the league with 13.8, and Monza.
Pressing often and well
The other side of defending is what happens before the opponent gets near the box. Pressing can limit the time and options available in build-up, create opportunities to win the ball back high up the pitch and instantly turn a defensive situation into an attacking one. But intensity and effectiveness are not the same thing.
Frosinone (7.58), Roma and Venezia have the lowest PPDA figures in the league, meaning they allow their opponents fewer passes on average before making a defensive action. The results, however, have been very different. Frosinone and Roma have conceded four and three goals respectively, while Venezia has already allowed 13. The Venetian side also combines its low PPDA with 11.8 xG conceded, one of the highest figures in the league. Their willingness to press aggressively is clear, but so far, that pressure has not provided the same level of protection once the first line is beaten.
Cagliari has taken almost the opposite approach. The league’s best defence, with just two goals conceded, also has the highest PPDA in Serie A (19.89). Pisacane’s side allows the opposition to circulate the ball more freely in the first phase and concentrates its defensive work closer to its own goal. But their 8.8 Expected Goals conceded, compared with just two goals allowed, adds an important layer to the picture: Cagliari has given up chances worth considerably more than the number of goals they have actually conceded, suggesting their defensive record has been less dominant than the goals-against figure alone would indicate.
Cagliari and Frosinone have therefore reached similar results through almost opposite approaches: the Sardinians sit deeper and focus more on protecting the final third, while Frosinone looks to win the ball back much earlier.
Roma: when winning the ball back becomes an attack
Roma is one of the clearest examples of a team where pressing intensity and effectiveness appear to go hand in hand. Gasperini’s principles are evident not only in their PPDA, but also in where and how often the Giallorossi are able to win the ball back.

Roma leads Serie A for recoveries in the attacking third, averaging 5.8 per game, ahead of Venezia and Juventus. They are also well clear of the rest for possessions won back in the central area, with 141, ahead of Juventus and Inter. But the final piece of the puzzle comes in attack: 17 shots have come from high recoveries, more than any other team in Serie A. Winning the ball back is therefore not simply a way to stop the opposition’s attack, but also a direct route to creating chances.
Perhaps this is the thread that best connects all the numbers from the opening five rounds. Possession, verticality, pressing and attacking output do not point to a single winning formula, but they are beginning to reveal each team’s identity and the path they are taking to achieve results. The season is still in its early stages and the standings can change, but the statistics are already starting to tell the story of the kind of Serie A its teams are building.